
Introduction
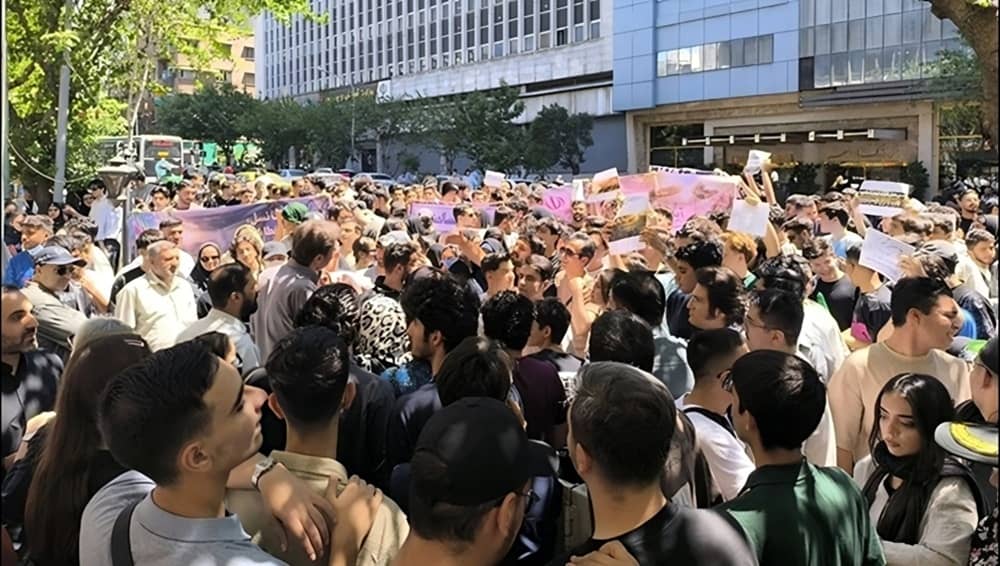
Iran experienced a sustained and geographically broad pattern of social protest in the Iranian year 1405 (20 March 2025 and 20 March 2026), reflecting mounting pressures across a wide range of occupational and social groups. During this twelve-month period, 4,229 protest events were documented, involving workers, retirees, truck drivers, bakers, university students, farmers, teachers, medical professionals and other sectors of society. The scale and diversity of these protests provide an important measure of the depth and breadth of social discontent during the period under review.
The year was distinguished not only by recurring sectoral protests but also by a major nationwide escalation between 22 December 2025 and 20 January 2026. Of the protests recorded during that period, 1,767 were classified as part of the nationwide uprising, marking a significant departure from the otherwise recurrent pattern of occupational and livelihood-based demonstrations. The report therefore examines two interconnected dynamics: persistent protests by individual social and professional groups, and the emergence of a broader nationwide mobilization layered upon this existing landscape of unrest.
These developments unfolded against a background of severe socioeconomic pressure. Rising prices for essential goods, escalating housing and transport costs, persistent inflation, declining purchasing power, and a substantial gap between household incomes and estimated living costs placed growing pressure on millions of Iranians. The evidence presented in this report does not assume that every individual protest can be attributed to a specific economic indicator. Rather, it examines how widespread mobilization developed in parallel with an increasingly acute livelihood crisis affecting diverse sections of society.
This report brings together protest data, sectoral analysis, monthly trends and selected economic indicators to provide a structured assessment of the protest landscape in Iran. It also compares the findings with the preceding reporting period, when 3,902 protests were recorded. The increase to 4,229 protests represents an overall rise of approximately 8.4 percent, but the significance of the change lies not merely in the numerical increase. The composition of protest activity shifted markedly, culminating in a large nationwide mobilization while continuing sectoral protests remained active throughout the year.
Taken together, these findings provide a basis for examining the 2025–2026 protest wave not as a collection of isolated workplace or local grievances, but as a broader pattern of social unrest developing amid sustained economic hardship and increasingly widespread dissatisfaction across Iranian society.
Key Findings
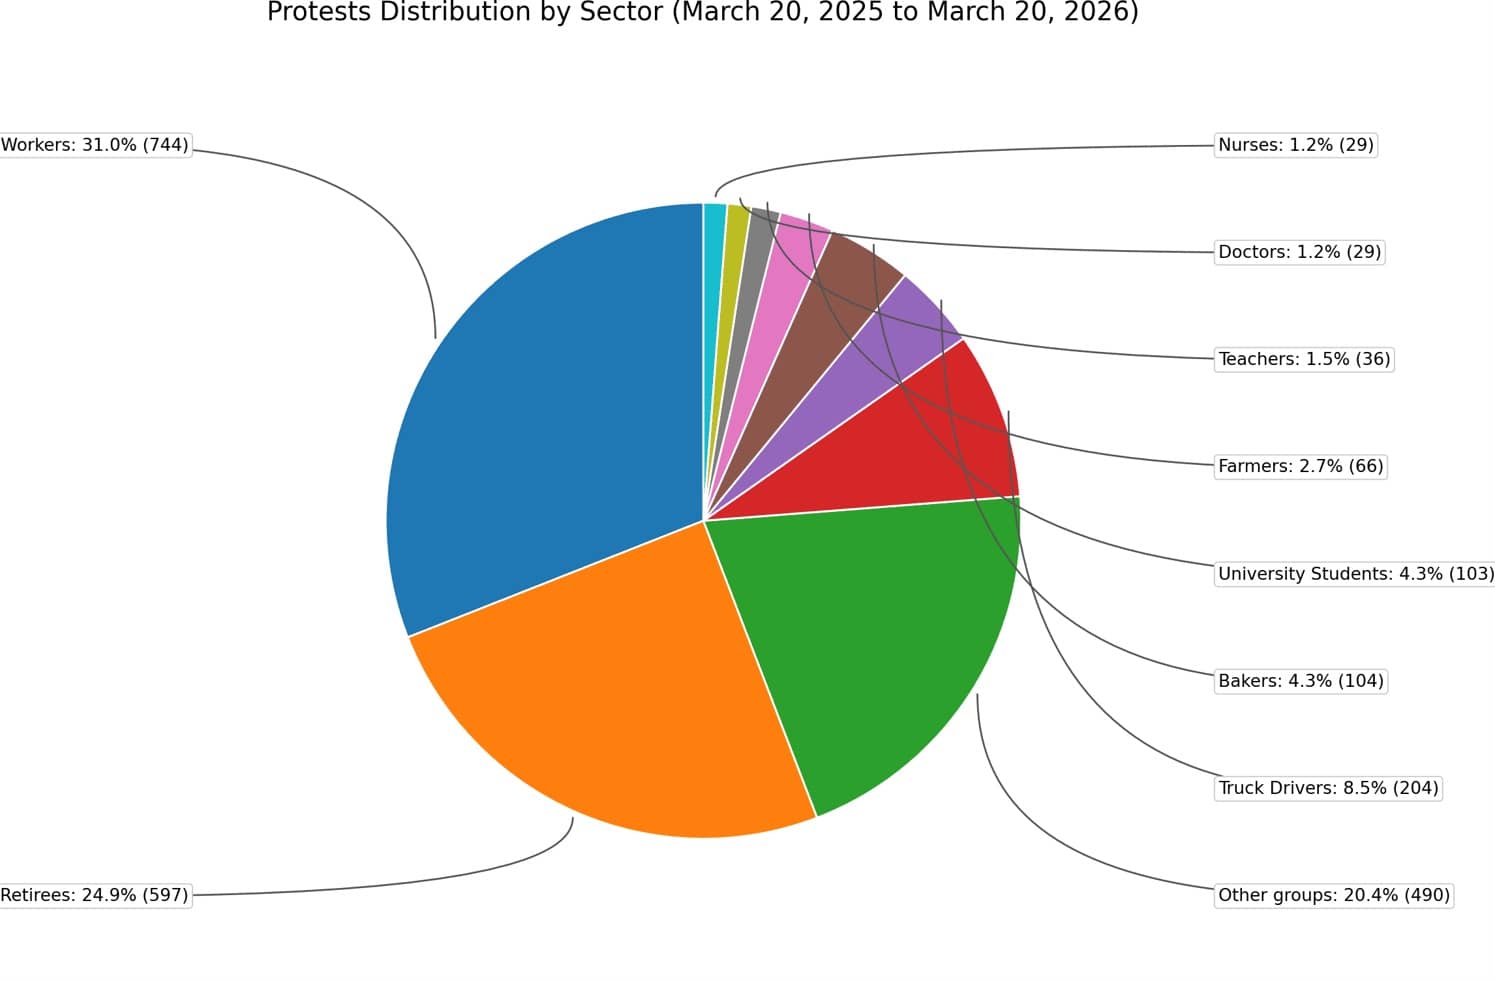
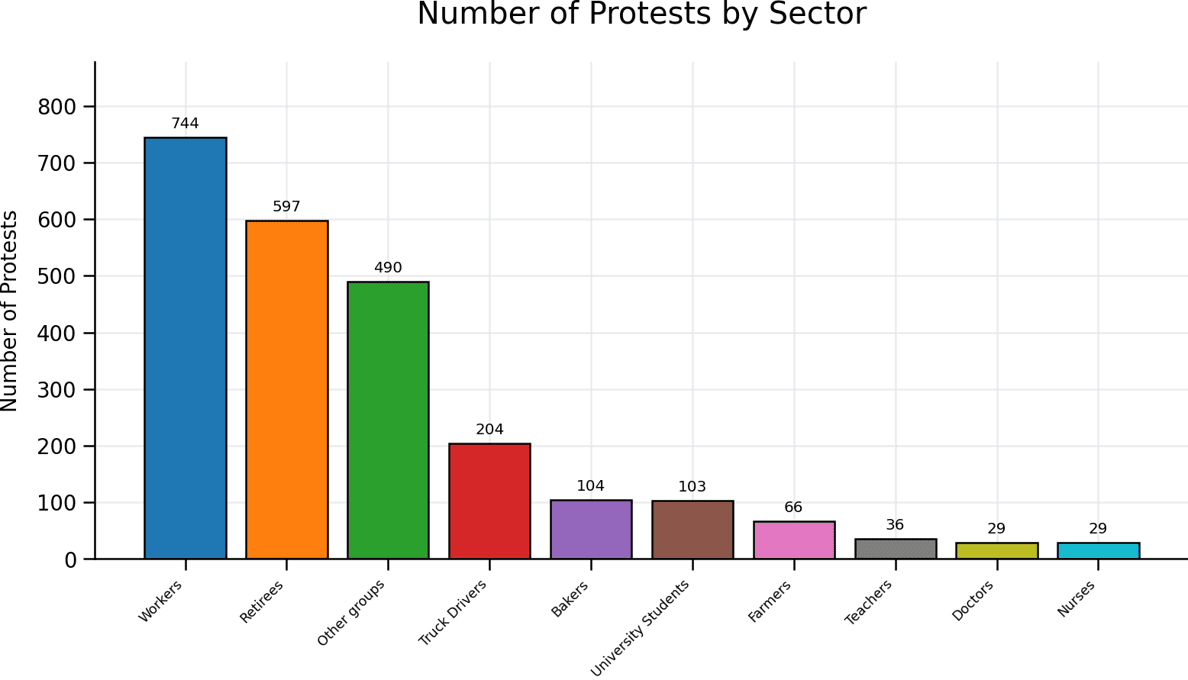
Total number of protests: 4,229. The largest monthly spike occurred during December 22, 2025 – January 20, 2026, with 1,839 protests, including 1,767 protest events categorized as the nationwide uprising in that period. Workers and retirees were the largest recurring constituencies outside the uprising category.
Breakdown by sector
| Sector | Number of Protests |
| Workers | 744 |
| Retirees | 597 |
| Other groups | 490 |
| Truck Drivers | 204 |
| Bakers | 104 |
| University Students | 103 |
| Farmers | 66 |
| Teachers | 36 |
| Doctors | 29 |
| Nurses | 29 |
Data-gathering context. As in the prior-year report, the protest figures are treated as a structured measure of social unrest across occupational, economic, educational, health-sector, agricultural, transport, and other social groups. The significance of the data lies in both the total number of events and the breadth of participation across sectors.
Visual Data Presentation
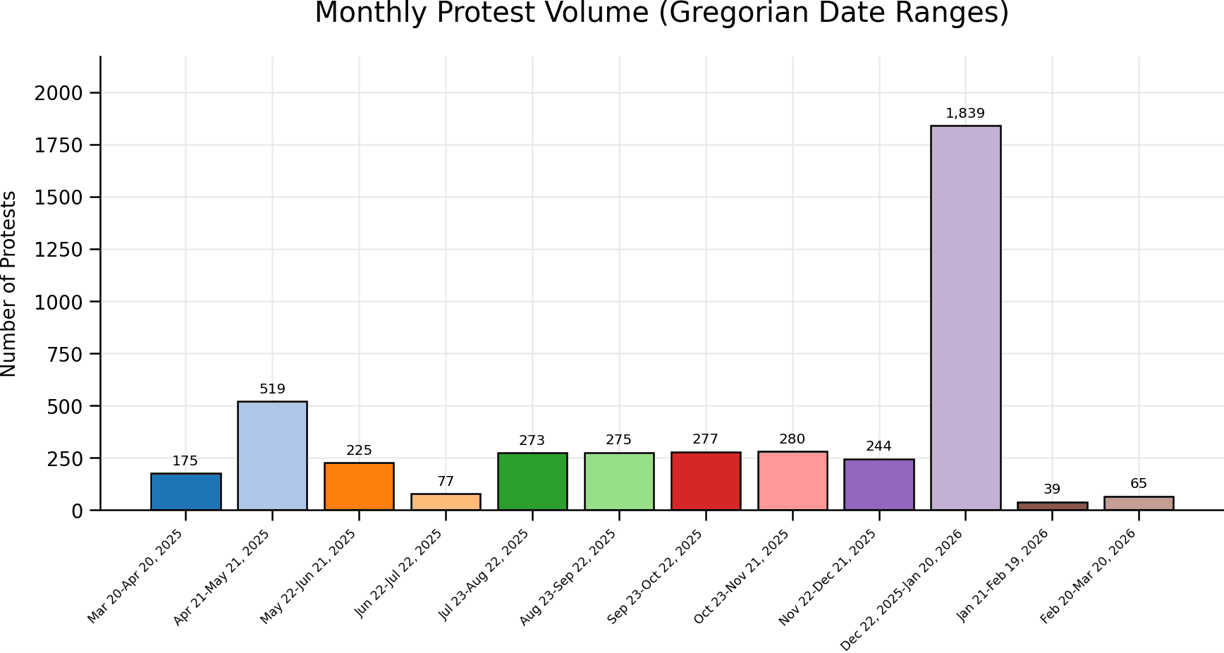
Socioeconomic Crisis: Context for the Protests
The protest data should be read alongside the provided economic and livelihood materials. Those materials show pressure from food prices, housing costs, transport expenses, reduced purchasing power, poverty-line gaps, and labor-market weakness. All monetary amounts below are converted to rials.
Soaring Cost of Living and Food Inflation
- Bread was the largest immediate price shock in the provided economic materials: lavash rose from 14,000 to 27,000 rials, taftoon from 23,000 to 45,000 rials, barbari from 53,000 to 100,000 rials, and sangak from 74,000 to 155,000 rials.
- Chicken experienced a sharp shock in late April-May, rising from about 2,800,000 rials to 3,580,000 rials per kilogram before moving toward relative stability later.
- Cooking oil remained one of the fastest-rising essential items, with a 900 ml bottle reported around 3,480,000 rials and continued pressure on household food baskets.
Housing, Rent, and the Cost of Urban Survival
- The economic brief notes that Tehran housing prices rose dramatically over recent years, with referenced figures equivalent to roughly 70,000,000 rials per square meter in 2018 and about 980,000,000 rials per square meter in 2024 in one estimate.
- Because housing and rent consume a large share of household income, housing pressure is a central driver of livelihood insecurity.
Transport, Fuel, and Indirect Cost Increases
- The report notes that the government reduced the 30,000-rial gasoline quota from 70 liters to 50 liters, creating an indirect increase in household fuel costs for some consumers.
- Urban bus and BRT fares in Tehran increased by about 25 percent from mid-May 2026, while private bus services were allowed increases of up to 42 percent in some cases.
- Intercity bus fares officially increased by 21 percent from June 6, 2026, adding further pressure to travel and commuting costs.
Wages, Inflation, and the Poverty Gap
- Minimum wages rose nominally by about 60 percent in 2026, with the base wage moving from roughly 104,000,000 rials to more than 166,000,000 rials. The briefs emphasize that nominal wage increases do not automatically restore real purchasing power.
- Inflation remained high, with the World Bank/IMF-based estimate for 2025 placed around 42.2 percent.
- Independent estimates placed the poverty line for a four-person household at roughly 350,000,000 to 450,000,000 rials in medium-sized cities and about 500,000,000 to 600,000,000 rials in Tehran, while many minimum-wage earners received about 220,000,000 to 250,000,000 rials monthly.
- On that basis, minimum income may cover only about 11 to 19 days of monthly living costs for a four-person household, depending on the city and poverty-line estimate.
Unemployment, Underemployment, and Hidden Economic Distress
- Official/standardized estimates place unemployment around 8.3 to 9.5 percent in 2025, equivalent to roughly 2.5 to 3 million unemployed people.
- The economic brief cautions that official unemployment does not fully capture discouraged workers, involuntary underemployment, and very low-hour work; some analytical estimates place effective unemployment or underemployment between 15 and 25 percent of the labor force.
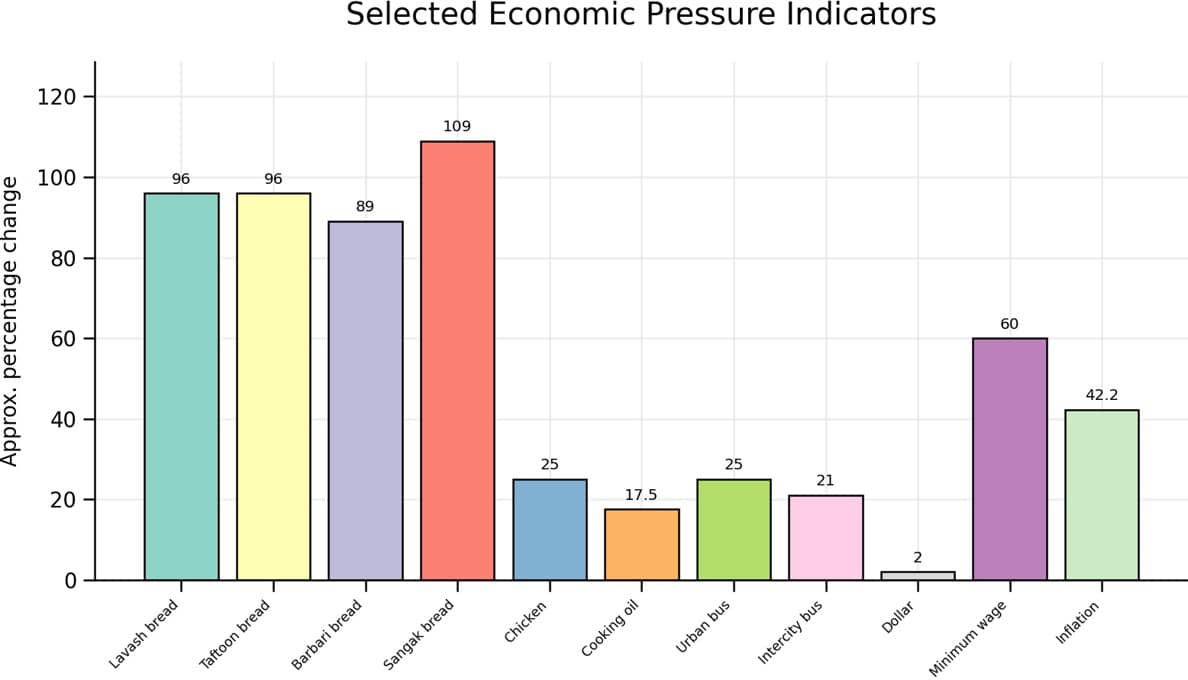
Selected Economic Indicators
| Indicator | Reported level or change | Interpretive relevance |
| Bread lavash | from 14,000 to 27,000 rials | approx. +93 to +100% |
| Bread taftoon | from 23,000 to 45,000 rials | approx. +96% |
| Bread barbari | from 53,000 to 100,000 rials | approx. +89% |
| Bread sangak | from 74,000 to 155,000 rials | approx. +109% |
| Chicken | about 2,800,000 to 3,580,000 rials/kg in late April-May | approx. +25% monthly |
| Cooking oil | 900 ml bottle around 3,480,000 rials | about +15 to +20% in period |
| Urban bus fares | Tehran city/BRT fares from mid-May 2026 | about +25%, private up to +42% |
| Intercity bus fares | national official fare increase from June 6, 2026 | +21% |
| Dollar exchange rate | about 1,880,000 to 1,930,000 rials per dollar | about +2% |
| Minimum wage | base wage from 104,000,000 to over 166,000,000 rials | about +60% nominal |
| Inflation | World Bank/IMF-based 2025 estimate | about 42.2% |
Analysis
The 2025–2026 protest data show two simultaneous dynamics: recurring sectoral protests throughout the year and a major national escalation during December 22, 2025 – January 20, 2026. The sectoral pattern is significant because protests were not concentrated in a single profession or locality; they appeared among workers, retirees, transport workers, students, farmers, teachers, medical professionals, and other social groups.
The economic materials help explain why these protests should be understood as part of a broader livelihood crisis. Food prices, especially bread, poultry, and cooking oil, placed direct pressure on household survival. Housing and rent costs intensified the squeeze on urban families. Transport and fuel-related costs made daily movement more expensive. At the same time, nominal wage increases did not erase the gap between income and the estimated cost of basic living.
The relationship between economic hardship and protest activity should be stated carefully: the data does not prove that each protest was caused by a specific price change. What the evidence does show is that widespread social mobilization unfolded in the same general period in which essential goods, housing, transport, wages, poverty, and labor-market indicators pointed to severe material pressure.
This combined pattern resembles the structure emphasized in the prior-year report: protests are not isolated labor complaints or scattered local grievances. They are signs of a wider social crisis in which many constituencies experience pressure through wages, pensions, food, housing, public services, employment, and the collapse of purchasing power.
While these patterns point to a broader social crisis, any assessment based solely on recorded protest events and socioeconomic indicators is necessarily incomplete. The dataset measures the occurrence, frequency and sectoral distribution of protests, but it does not systematically measure other political and organizational factors that may contribute either to the continuation of protest activity or to its suppression. These variables are particularly important in the Iranian context, where social mobilization develops under extensive state surveillance, coercive security measures, arrests and the threat of severe punishment.
One such factor that warrants consideration is the continued presence of organized opposition networks inside Iran. In particular, the activities of the PMOI/MEK-affiliated Resistance Units represent a dimension of anti-government mobilization that is not captured by the protest-count dataset itself. NCRI and PMOI/MEK sources have reported repeated Resistance Unit activities across Tehran and numerous other cities, including operations directed against the Revolutionary Guards, the paramilitary basij forces, institutions and symbols associated with state repression, despite extensive surveillance and heightened security measures. Such activity was reported repeatedly in the months surrounding and following the period examined in this report.
The protest dataset used in this study was not designed to quantify the precise causal contribution of the Resistance Units to the overall number of public protests. Nevertheless, their continued organized activity remains highly relevant to understanding the broader dynamics of protest and dissent. Operating in an environment in which participation carries serious personal risks, these networks help sustain visible opposition to the state, challenge the regime’s efforts to project an image of complete control, and contribute to preserving an atmosphere in which broader social grievances can develop into more explicitly anti-government mobilization.
The opposite side of this dynamic—the state’s sustained effort to prevent mobilization—must also be incorporated into the analysis. Protest figures should not be read simply as an expression of the level of public dissatisfaction; they are also the observable outcome of mobilization taking place under conditions deliberately designed to make protest difficult and dangerous.
Following the January 2026 uprising, Iranian authorities imposed sweeping military-style security measures, including heavily armed deployments, dense networks of checkpoints and patrols, restrictions on movement and measures aimed at preventing street gatherings. Amnesty International reported that these measures were accompanied by mass arrests, enforced disappearances, nighttime curfews and prohibitions on gatherings. These measures demonstrate the degree to which the authorities sought to prevent a recurrence of large-scale mobilization rather than merely respond to individual demonstrations.
This security presence became still more visible following the outbreak of the US–Israel war with Iran. In March 2026, Iran’s police chief confirmed that police and Basij forces were patrolling Tehran and cities across the country “day and night” in the aftermath of the protests and since the beginning of the war. Heavily armed checkpoints and pro-government street mobilization were also used amid official warnings against renewed anti-government protests. The significance of this development is considerable: protest activity during this period took place not in the absence of state deterrence, but under an intensified security strategy explicitly intended to prevent further mobilization.
The regime’s use of executions, death sentences, imprisonment and pressure on political detainees forms part of the same broader deterrence environment.
The significance of the protest data must therefore be assessed against three overlapping forces: deepening socioeconomic pressure, continuing organized opposition activity, and an increasingly coercive state response intended to deter public mobilization.
Seen in this context, the persistence of protest cannot be understood simply as the mechanical consequence of worsening economic conditions. Economic hardship creates powerful grievances, but grievances alone do not explain why protest continues under conditions in which participation can result in arrest, imprisonment or potentially far more severe punishment. The continued existence of organized networks willing to undertake anti-government activities despite these risks is therefore relevant to understanding the resilience of the wider protest environment.
This does not mean that every labor, pension, student or livelihood protest was organized or directed by the PMOI/MEK or its Resistance Units. Rather, the analytical significance of organized resistance lies in its potential contribution to preserving a wider environment of defiance: demonstrating the continued possibility of organized opposition, contesting the state’s attempt to impose political passivity, and helping prevent severe repression from translating automatically into the disappearance of visible dissent.
The resulting pattern therefore resembles, but also goes beyond, the structure identified in the previous year’s report. These protests cannot be viewed simply as isolated labor disputes or disconnected local grievances. They form part of a wider social and political crisis in which dissatisfaction arising from wages, pensions, food prices, housing, public services, employment and the collapse of purchasing power interacts with organized opposition activity and an increasingly intensive state apparatus of deterrence and repression.
Against this background, the nationwide uprising of December 22, 2025–January 20, 2026, represents a structural break in the annual pattern. It emerged on top of an already active landscape of sectoral protest and marked the point at which dispersed economic, social and political grievances developed into a much broader form of national mobilization. Rather than appearing as an isolated eruption, the uprising is more appropriately understood as the most visible escalation of tensions that had accumulated throughout the reporting period.
Conclusion
The 4,229 protests documented for March 20, 2025, to March 20, 2026, reveal an unusually broad protest landscape, culminating in the December 22, 2025 – January 20, 2026, nationwide uprising. Workers and retirees were the largest recurring protest constituencies, but the broader distribution across social sectors shows that discontent extended far beyond a single economic group.
When combined with the provided economic materials, the protest data point to a society experiencing sustained pressure from essential-goods inflation, housing and rent burdens, transport costs, weakened purchasing power, poverty-line gaps, and underemployment. The revised report therefore frames the 2025–2026 protest wave as both a political and socioeconomic phenomenon: a pattern of national unrest rooted in everyday material hardship and amplified by the breadth of affected social groups.
Comparative Analysis: 2024–2025 vs. 2025–2026
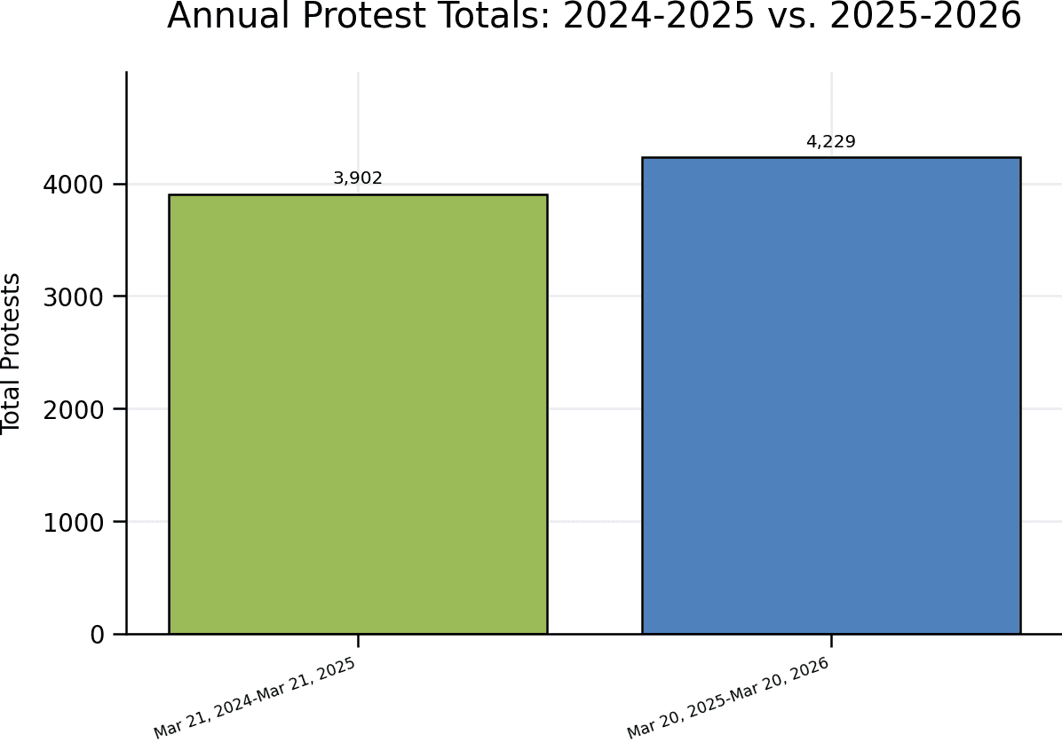
Total recorded protests increased from 3,902 in the March 21, 2024 – March 21, 2025, report to 4,229 in the March 20, 2025 – March 20, 2026, report. This is an increase of 327 protests, or approximately 8.4 percent.
| Reporting period | Total protests | Change from prior period |
| Mar. 21, 2024 – Mar. 21, 2025 | 3,902 | — |
| Mar. 20, 2025 – Mar. 20, 2026 | 4,229 | +327 / +8.4% |
Sectoral shifts
| Sector | 2024-2025 | 2025-2026 | Change | Percent change |
| Workers | 1,836 | 744 | -1,092 | -59.5% |
| Retirees | 2,156 | 597 | -1,559 | -72.3% |
| Other groups | 1,814 | 490 | -1,324 | -73.0% |
| Truck Drivers | 136 | 204 | +68 | +50.0% |
| Bakers | 24 | 104 | +80 | +333.3% |
| University Students | 112 | 103 | -9 | -8.0% |
| Farmers | 166 | 66 | -100 | -60.2% |
| Teachers | 106 | 36 | -70 | -66.0% |
| Doctors | 32 | 29 | -3 | -9.4% |
| Nurses | 1,186 | 29 | -1,157 | -97.6% |
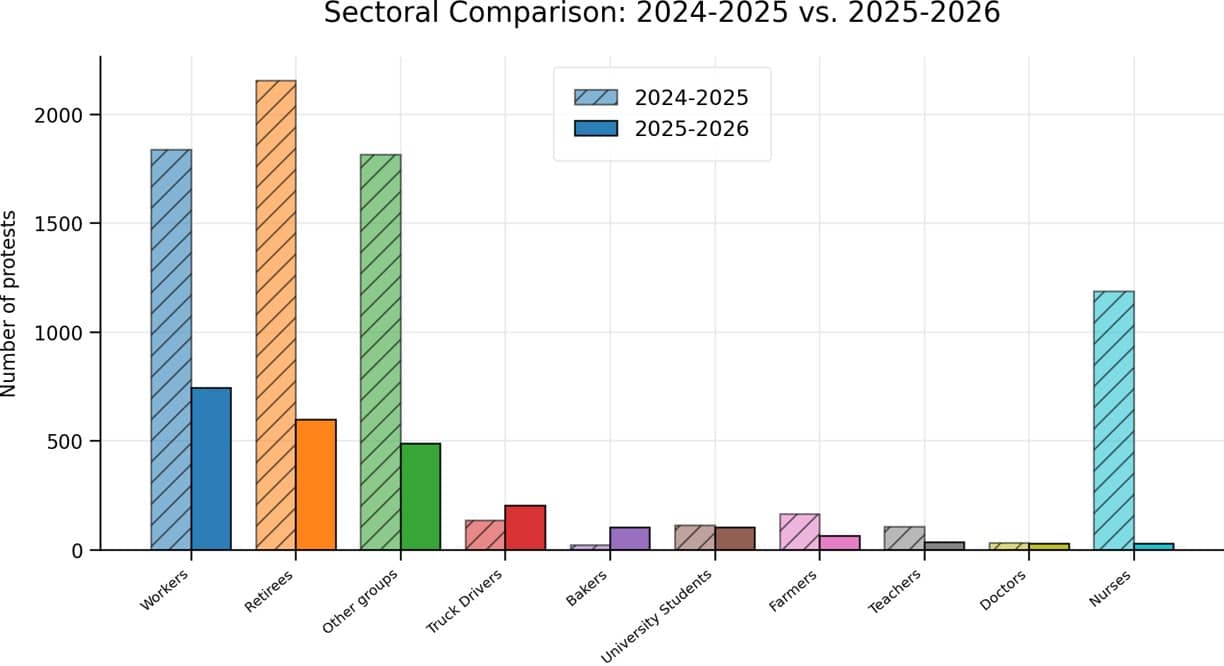
The overall number of protests rose modestly, but the structure of protest activity changed sharply. In the shared sector categories, several recurring social sectors registered lower counts in 2025–2026 than in the prior-year report. The most notable declines in the shared categories were retirees, workers, nurses, and other groups.
At the same time, the 2025–2026 report contains a major nationwide uprising category for December 22, 2025 – January 20, 2026, accounting for 1,767 events. This explains why the total annual count rose even though several recurring sector categories were lower than in the prior-year report.
The comparative takeaway is therefore not simply that protests increased. Rather, the annual total increased by about 8.4 percent while the pattern shifted from very high recurring sectoral counts in the previous report toward a year defined by one major nationwide escalation layered on top of continuing sectoral protests.
Ali Safavi (@amsafavi), a sociologist by career, is a member of the Foreign Affairs Committee of the Paris-based National Council of Resistance of Iran (NCRI)